

A stakeholder asks whether AI search is helping the business. You have Google impressions, Bing citations and a few referral visits. Adding them together would produce a large number with no clear meaning.
An AI search performance report should explain what each source measures, what changed and what the team will do next. First build a reviewed summary. Then export that summary as a PDF using your approved document or reporting tool.
We ran this reporting method locally using synthetic CSV data and generated a one-page PDF. Product documentation was checked on 10 November 2026. However, we did not export data from a connected platform account or test an account integration.
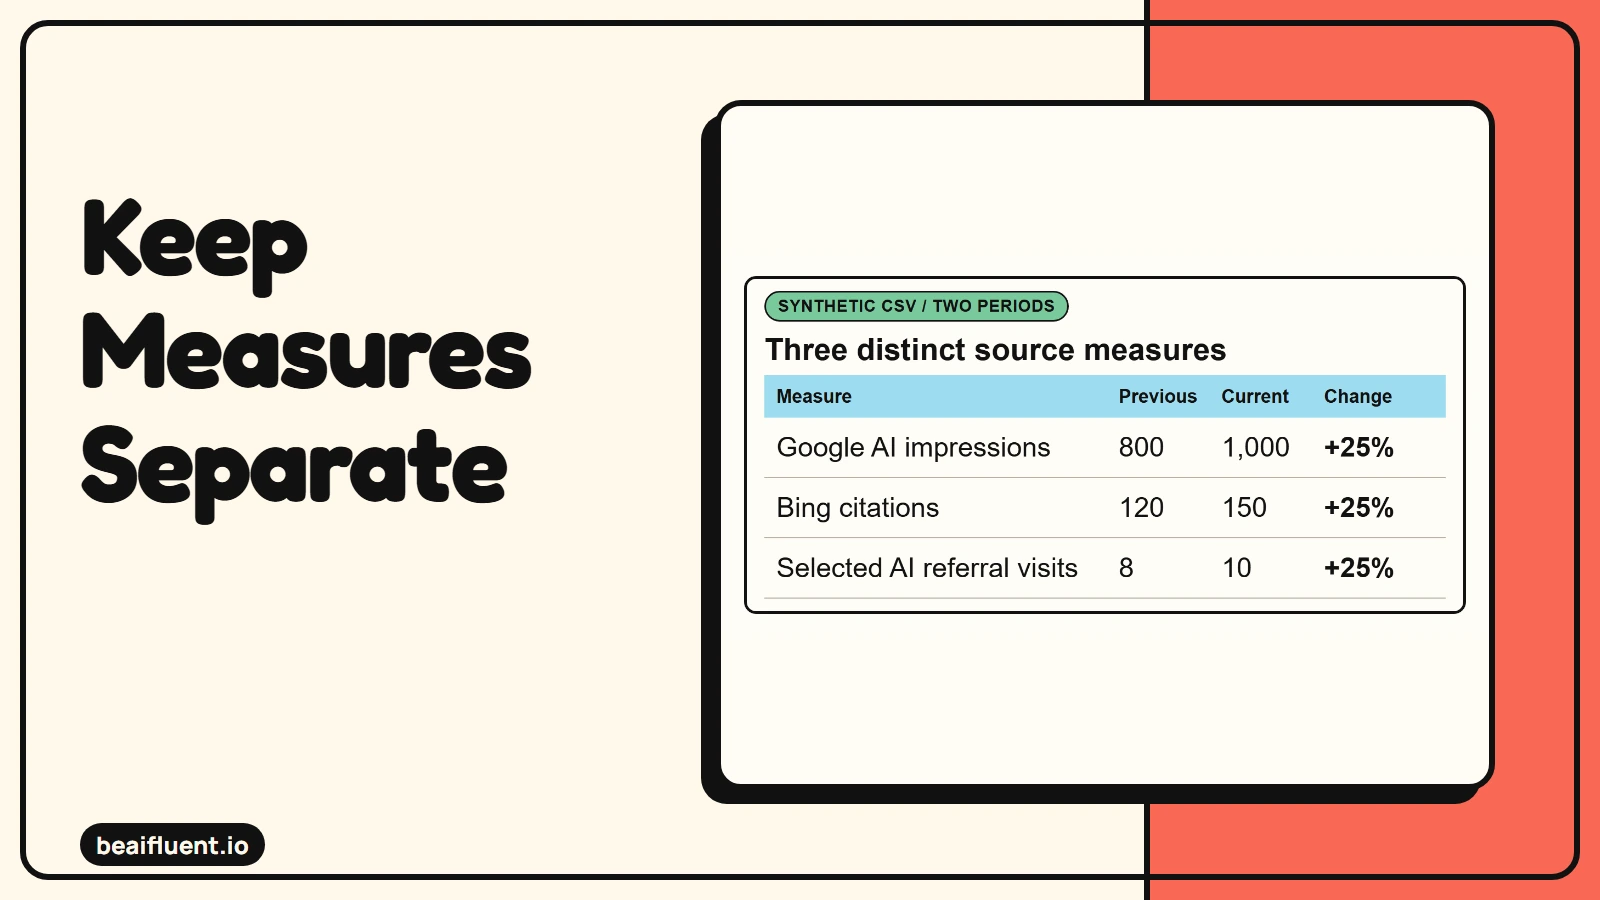
Synthetic CSV example: three different measures stay in distinct rows and are not added together.
Choose a reporting question before a PDF tool
Start with the decision your reader needs to make. For example: “Which useful pages gained visibility, and which should we investigate next?” That question is more useful than a single combined AI score.
Use a spreadsheet to organize exports and a document or presentation tool to explain them. Alternatively, use an approved reporting platform that preserves source definitions. Before purchasing anything, check whether its export, permissions and measurement coverage fit your actual reporting task.
For the wider publishing context, see our guide to AI SEO best practices. This article focuses on the report you prepare after that work, rather than promising a ranking method.
Keep the measures in separate lanes
Use each platform’s own definition. Although two numbers may both describe visibility, they do not necessarily count the same event.
| Source | What the report can tell you | What it does not establish |
|---|---|---|
| Google Generative AI performance | Impressions in supported Google AI search features | A separate count of AI clicks or conversions |
| Bing AI Performance | Citation activity and cited-page information | A universal rank or business outcome |
| Website analytics | Visits and actions observed under your tracking setup | Every exposure to an AI answer |
| A third-party prompt sample | Results from its stated prompts and collection method | Complete platform-wide visibility |
Google’s dedicated report covers impressions in AI Overviews and AI Mode. Its data also sit within broader Web performance data. Therefore, do not add those two reports as independent totals.
Google also warns that aggregation differs between property and page views. A sum of page rows may differ from the chart total. Preserve the view and filters behind each figure so readers can reproduce the comparison.
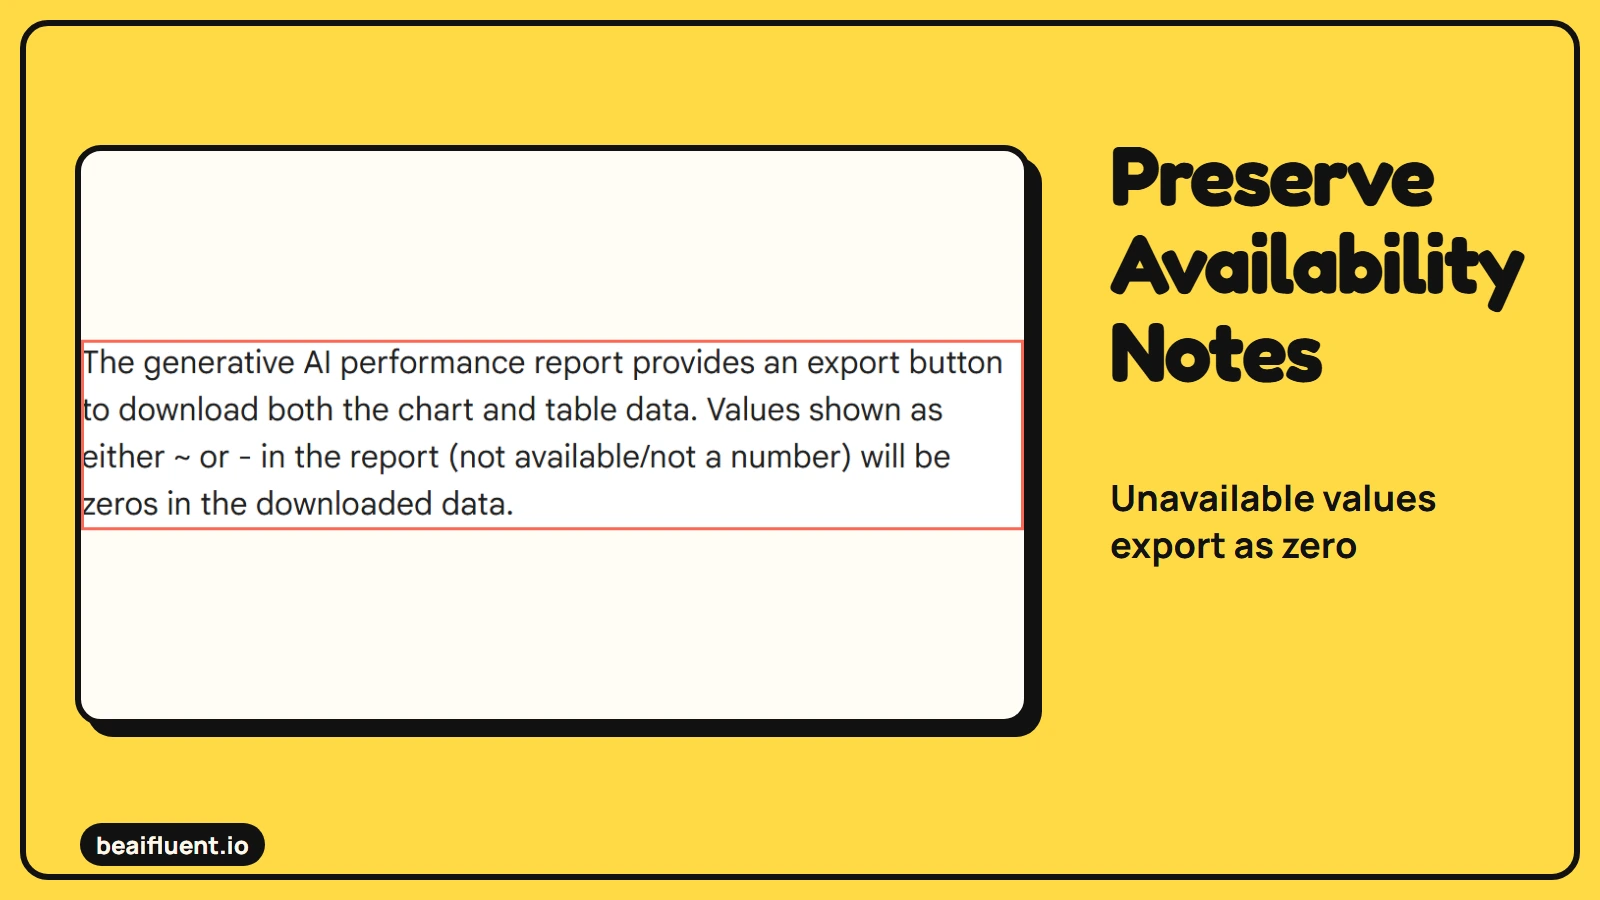
Selected Google Search Console Help excerpt for its Generative AI performance report.
Read Bing citations as citations
Bing’s AI Performance introduction describes citation activity, cited pages and sampled grounding queries across supported experiences. However, a citation count is not a ranking, authority score or count of visits.
For your analysis, treat a rise after a page update as an observation, rather than proof that the update caused it. Record other changes and avoid assigning a cause from timing alone.
In a first-person reporting discussion, a site owner contrasts citation activity with much smaller referral traffic. However, that anonymous account is anecdotal, rather than a benchmark. Instead, use it to understand why visibility and visits need separate reporting.
Assemble the report in six steps
Keep the raw exports, because a stakeholder summary is easier to correct when each figure has a source. Use the same periods and filters when making a comparison.
- Record the reporting scope. Write the site, exact dates, timezone, countries, devices and source tools. Note access limits or missing reports.
- Export each source. Save original files with the export date. Keep platform measures in separate columns or tables.
- Preserve unavailable values. Capture limitations before cleaning the data. Do not silently turn unknown values into confirmed zeros.
- Calculate comparisons. Match the measure and filters across periods. Show the absolute change alongside any percentage.
- Write the interpretation. Separate what changed from possible explanations. Give each next action an owner.
- Export and inspect the PDF. Check chart labels, table wrapping, clickable links and source notes. Then verify sharing permissions for the intended audience.
If you ask AI to draft the summary, give it only approved data and exact definitions. Review the arithmetic yourself, using the habits in our guide to checking AI accuracy.
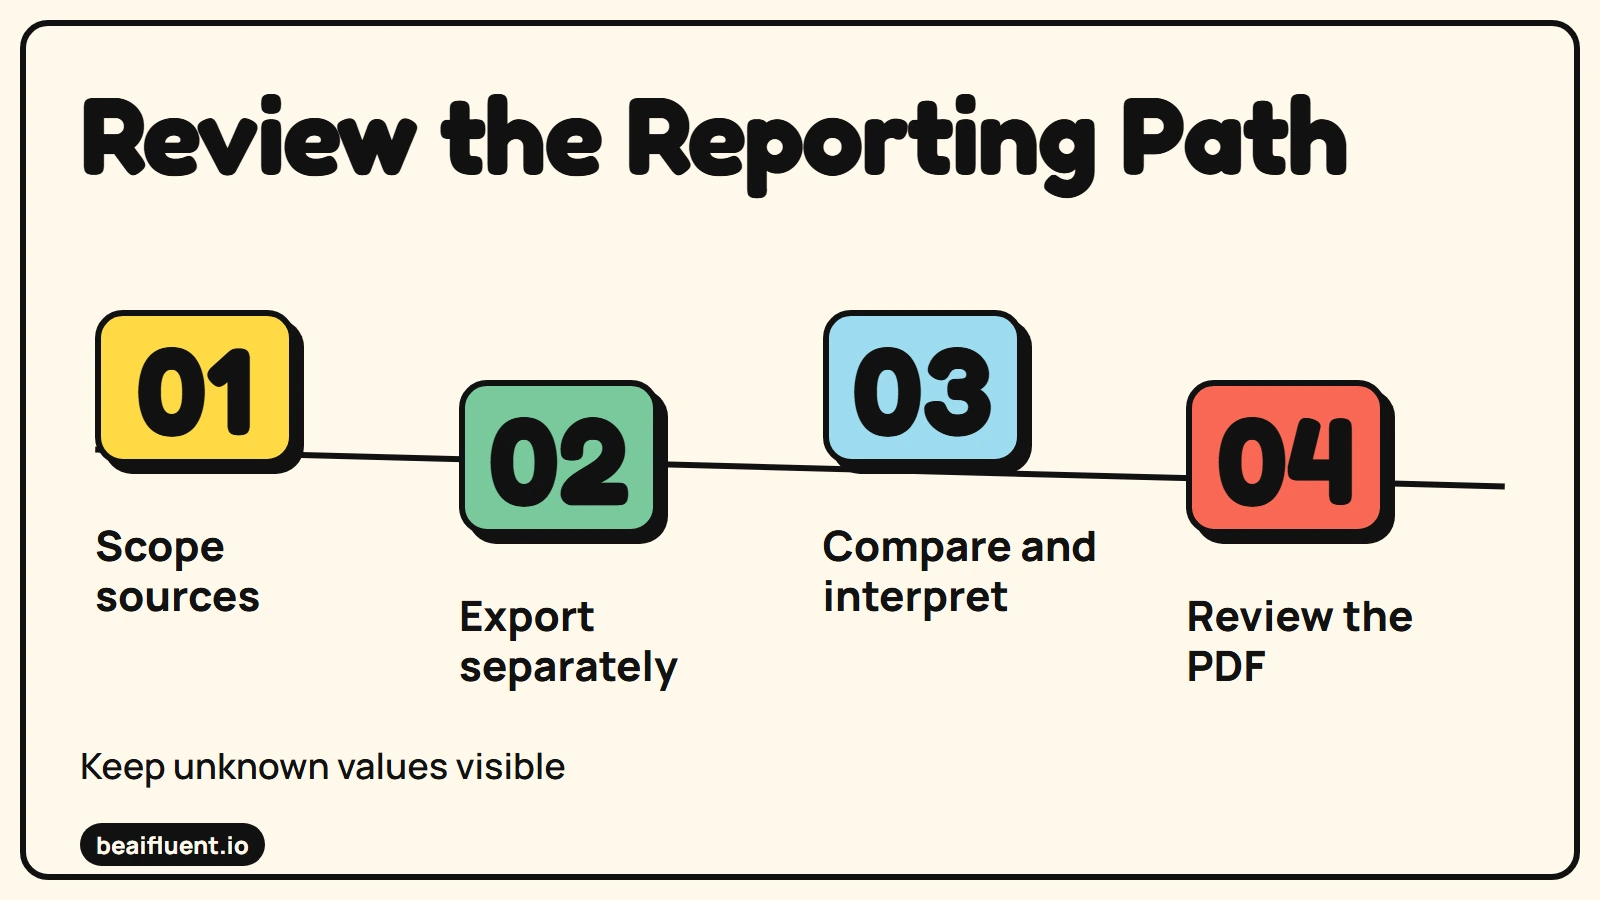
Record scope, preserve unavailable values and trace each figure before sharing the reviewed PDF.
Preserve an important Google export limitation
Google’s export documentation states that unavailable values displayed as a tilde or dash become zeros in downloaded data. Therefore, an exported zero does not always prove that the underlying measure was a confirmed zero.
Before export, retain the relevant report view or an availability note. If you only have an export, disclose that some zeros may represent unavailable values. Avoid a claim of complete absence when the source cannot distinguish it.
Also separate preliminary data from settled reporting periods. Otherwise, a comparison may change simply because collection is still underway.
A synthetic stakeholder summary
These invented figures demonstrate the format, rather than a real site’s performance. Assume each row uses matching filters in two equal reporting periods.
| Measure | Previous period | Current period | Interpretation |
|---|---|---|---|
| Google AI impressions | 800 | 1,000 | Up 200, or 25% |
| Bing citations | 120 | 150 | Up 30, or 25% |
| Analytics visits from selected AI referrers | 8 | 10 | Up 2; small sample |
Therefore, keep all three rows. Do not report 1,160 “AI interactions” by adding the current values, because that total combines different events and measurement systems.
A defensible summary would say: “Visibility rose in both platform reports. Observed referral visits remained low. Next, review which useful pages gained visibility and whether their landing experience supports the intended action.”
That wording does not promise revenue or attribute the change to one edit. If the previous value is zero or unavailable, show the absolute comparison and explain the limitation instead of forcing a percentage.
What we tested in the local report
We saved the three measure rows to CSV, read them into Python and calculated each change separately. Then we generated a one-page PDF with ReportLab and rendered it for visual review. The output preserved the three different measure names and their 25% changes.
We also tested a simulated unavailable Google value whose export showed zero. Because its availability flag was false, the summary retained it as unavailable and skipped its change calculation. A separate zero-baseline case also produced no percentage change.
To repeat this small demonstration, enter the table above in a CSV, calculate changes row by row and export a summary with separate measures. Before sharing, have a reviewer trace each figure back to the CSV and inspect the PDF for clipping or unreadable text.
The run used installed Python, ReportLab and a local PDF renderer. It made no AI or service calls, so no API charge applied; machine costs and review time were unmeasured. Real account access, exports, attribution settings and sharing permissions still need separate checks.
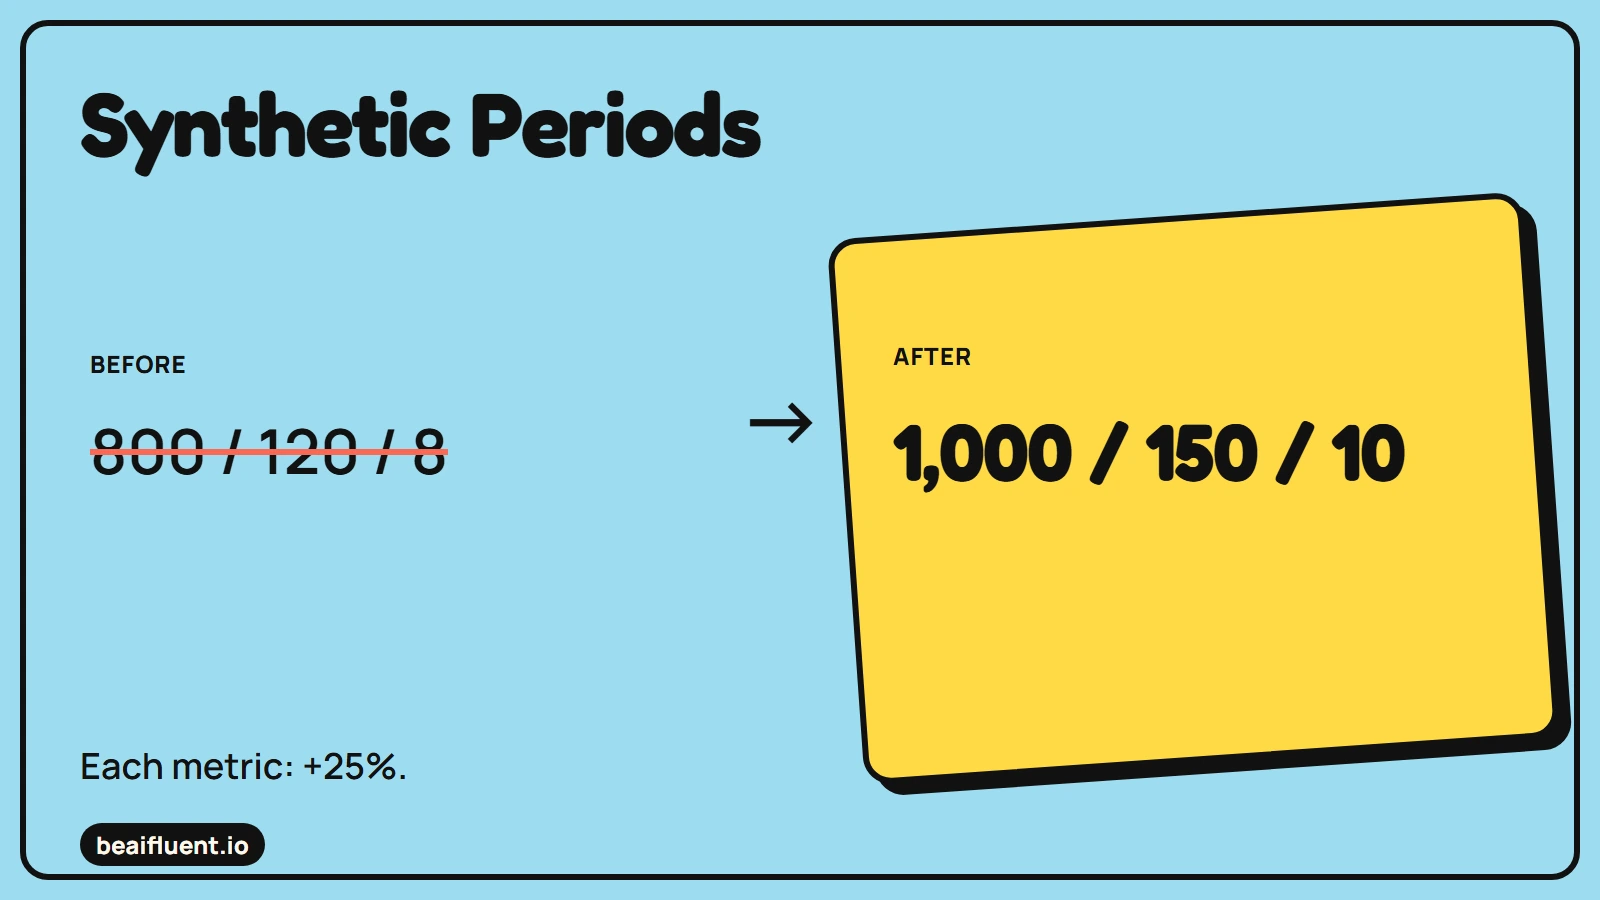
Synthetic period comparison: impressions, citations and visits each rise 25%; these distinct measures are not combined.
What belongs in the shareable PDF
Keep the decision near the start. A short report can include an opening summary, a measure table, a page-level finding and a next-action list. Put detailed definitions and source links where a reviewer can find them.
Although a PDF preserves a presentation, it does not verify its numbers. Approve the source data and interpretation before approving the export.
Before sharing, confirm the practical details:
- The title names the site and reporting period.
- Every chart states its measure and source.
- Filters, timezone and extraction date are visible.
- Unknown and preliminary data have clear labels.
- Claims of cause or business impact have supporting evidence.
- Links work, small text remains readable and tables fit the page.
- The file contains no account secrets or unintended client data.
Schedule the next comparison with the same definitions. A report becomes useful when a reader can connect a supported observation to a sensible next action, then check the result later.