
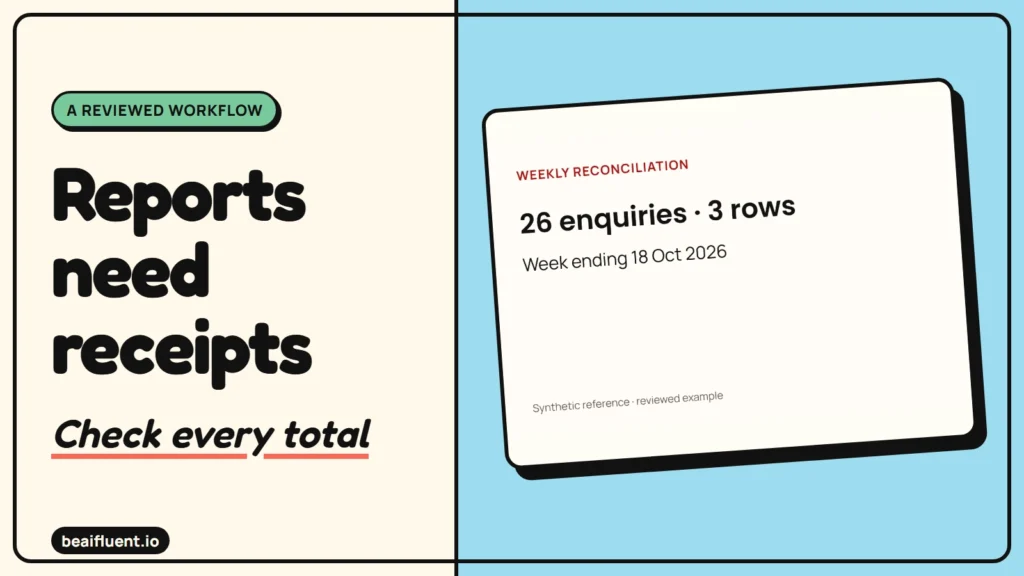
A weekly report can look polished while counting the same export twice. Another common mistake is quieter: a blank cell becomes zero, and a paragraph turns incomplete data into a confident business claim.
Use AI weekly reports from spreadsheets to draft the explanation after you check the numbers. Define the reporting week, remove confirmed duplicates, and preserve missing values first. Then give AI the checked summary and ask it to describe only what the data supports.
This walkthrough includes fictional CSV rows, reference totals and a copyable reporting prompt. We ran local calculations against the sample records. We did not connect business systems, test a live ChatGPT session or measure time saved.
Free template: Copy the weekly reporting sheet layout into a blank spreadsheet. It separates values from their source and shows whether each number is known, missing, or still under review.
Set the reporting rules before opening a chat
First choose one reporting period and one owner for the source data. For this example, the week ends on 18 October 2026. Counts describe a weekly operational snapshot, while the value field describes quotes issued, in Philippine pesos.
The sample does not connect each accepted enquiry to its original quote. Therefore, do not label accepted divided by quoted as a customer conversion rate. It also contains no cost data, payment records or reliable comparison week.
If you need the wider process first, read how to build AI workflows without code. The important reporting decision is where the trusted numbers come from; the choice of chat tool follows that decision.
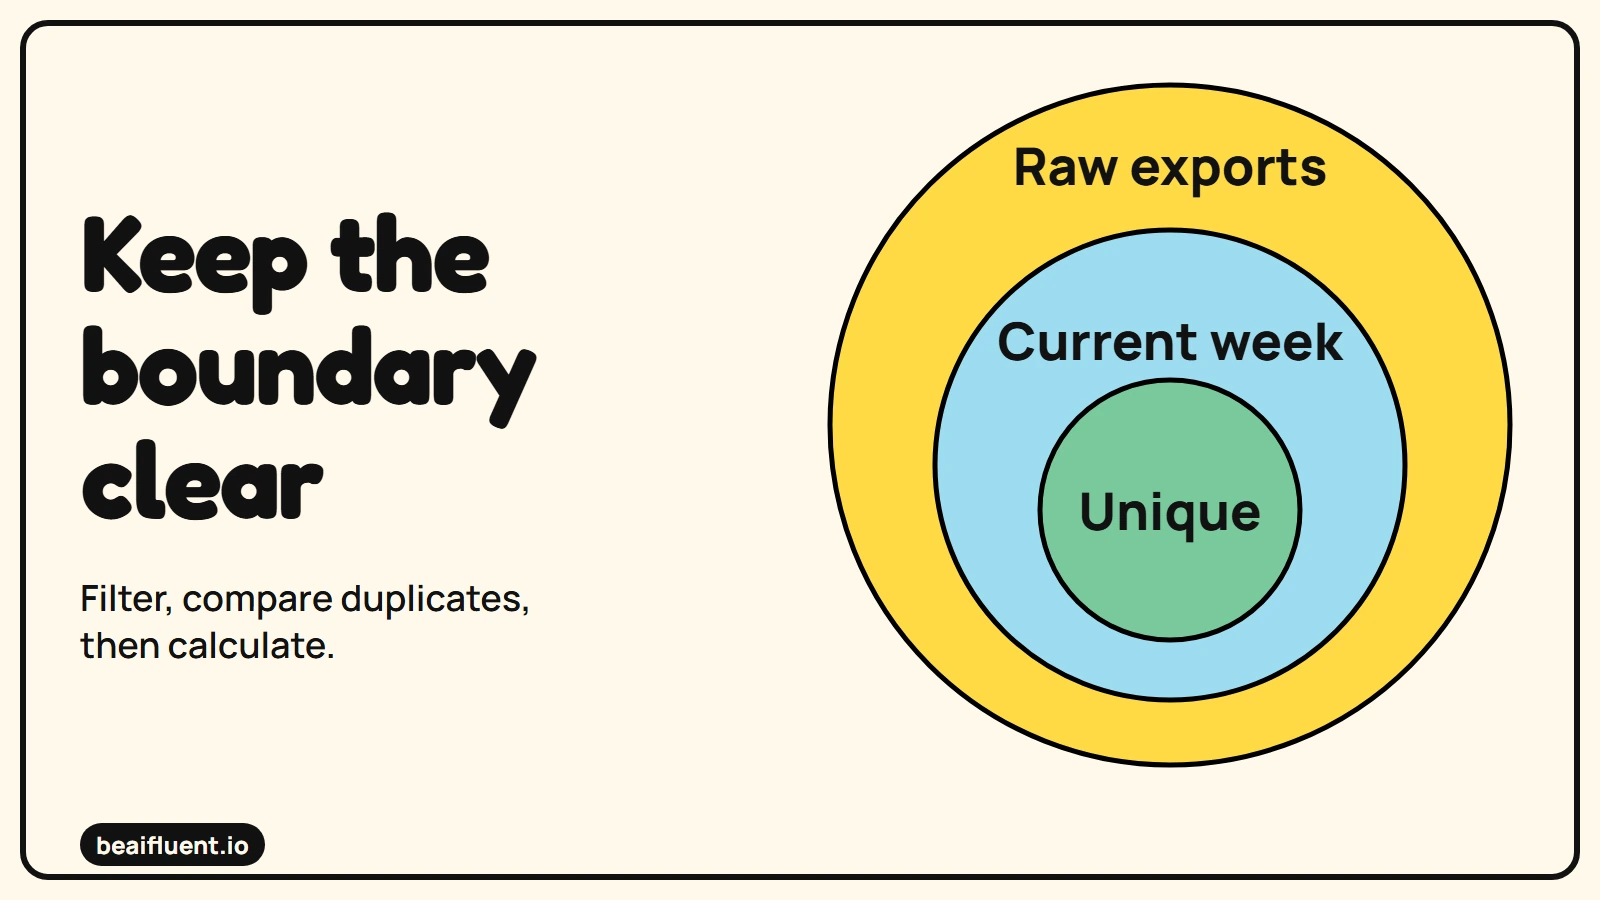
Filter, compare duplicates, then calculate.
1. Copy the sample CSV
First, paste these rows into a blank sheet or save them as a CSV. Before calculating, leave the empty Social qualified field empty. The repeated R2 is an intentional duplicate, while R4 belongs to a different reporting week.
row_id,week_ending,channel,enquiries,qualified,quoted,accepted,quoted_value_php
R1,2026-10-18,Website,12,5,3,1,30000
R2,2026-10-18,Referrals,8,4,2,1,24000
R2,2026-10-18,Referrals,8,4,2,1,24000
R3,2026-10-18,Social,6,,1,0,9000
R4,2026-10-11,Website,9,4,2,1,20000
Before working with a real export, check what a row represents. For example, a row here is a weekly channel summary rather than an individual customer. Mixing row types would make both deduplication and totals unreliable.
OpenAI’s data-analysis documentation recommends descriptive headers and one record per row. It also advises checking code, assumptions and results. File support and limits vary by account, so use a clean CSV rather than relying on a screenshot of a sheet.
2. Reconcile the rows and calculate totals
First filter to the reporting week. Next, compare repeated IDs: identical R2 records represent one summary, so keep one. If the same ID contains different values, stop and ask the source owner which record is current.
Retain the blank qualified value as unknown. The Website and Referrals rows supply nine known qualified enquiries, but the Social count is missing. Consequently, nine is a known subtotal, not the week’s complete qualified total.
| Check | Reviewed result | What it means |
|---|---|---|
| Current-week unique rows | 3 | R1, R2 and R3 |
| Enquiries | 26 | 12 + 8 + 6 |
| Qualified, known subtotal | 9 | 5 + 4; one channel missing |
| Quoted | 6 | 3 + 2 + 1 |
| Accepted | 2 | 1 + 1 + 0 |
| Quoted value | PHP 63,000 | 30,000 + 24,000 + 9,000; not revenue |
If you are checking the sample in a sheet, place only the three retained rows in a clean tab. Then use SUM on the complete numeric columns and COUNTBLANK on qualified. Check the known qualified subtotal separately and label it beside the blank count.
Do not sum the raw export and hope the model notices the problem. Our local reference calculation excludes one duplicate and one out-of-period row before adding values. The resulting total describes this small sample, not a business benchmark.
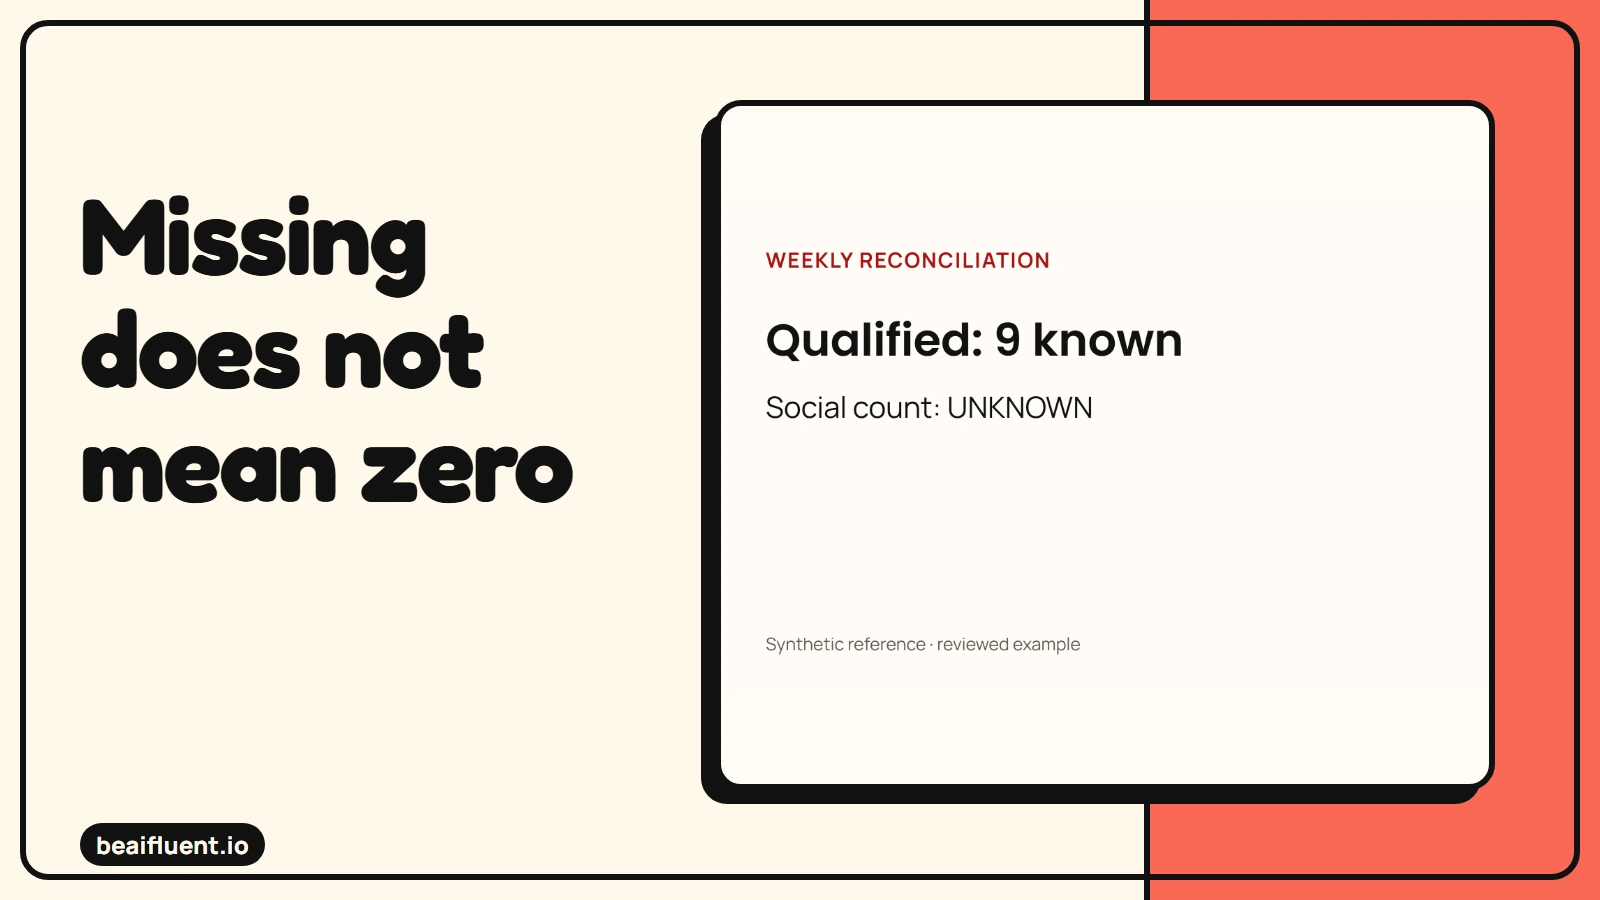
Prepared synthetic reference, checked locally; no live integration test.
3. Ask AI to draft from the checked summary
Use a short prompt with both the source rules and totals. If your approved tool supports file analysis, you can provide the CSV as well. However, still compare its calculations with the independent reference table.
Draft a short weekly operational report from these checked facts.
Period: week ending 18 October 2026. Currency: PHP.
After filtering and exact-duplicate removal: 3 channel rows.
Enquiries 26; quoted 6; accepted 2; quoted value 63000.
Qualified known subtotal 9; Social qualified count UNKNOWN.
Quoted value is not revenue. These are weekly snapshot counts.
There is no valid full comparison week or customer cohort link.
Return: checked totals, a short narrative, missing-data questions,
and next actions for a person. Do not invent causes or trends.
Do not fill blanks with zero or present 9 as a complete total.
Ask for the calculation steps before accepting any new number. OpenAI’s analysis guidance describes ways to inspect data and identify possible duplicates or missing values. Those suggestions still need a source check; detection is not proof that a row should be deleted.
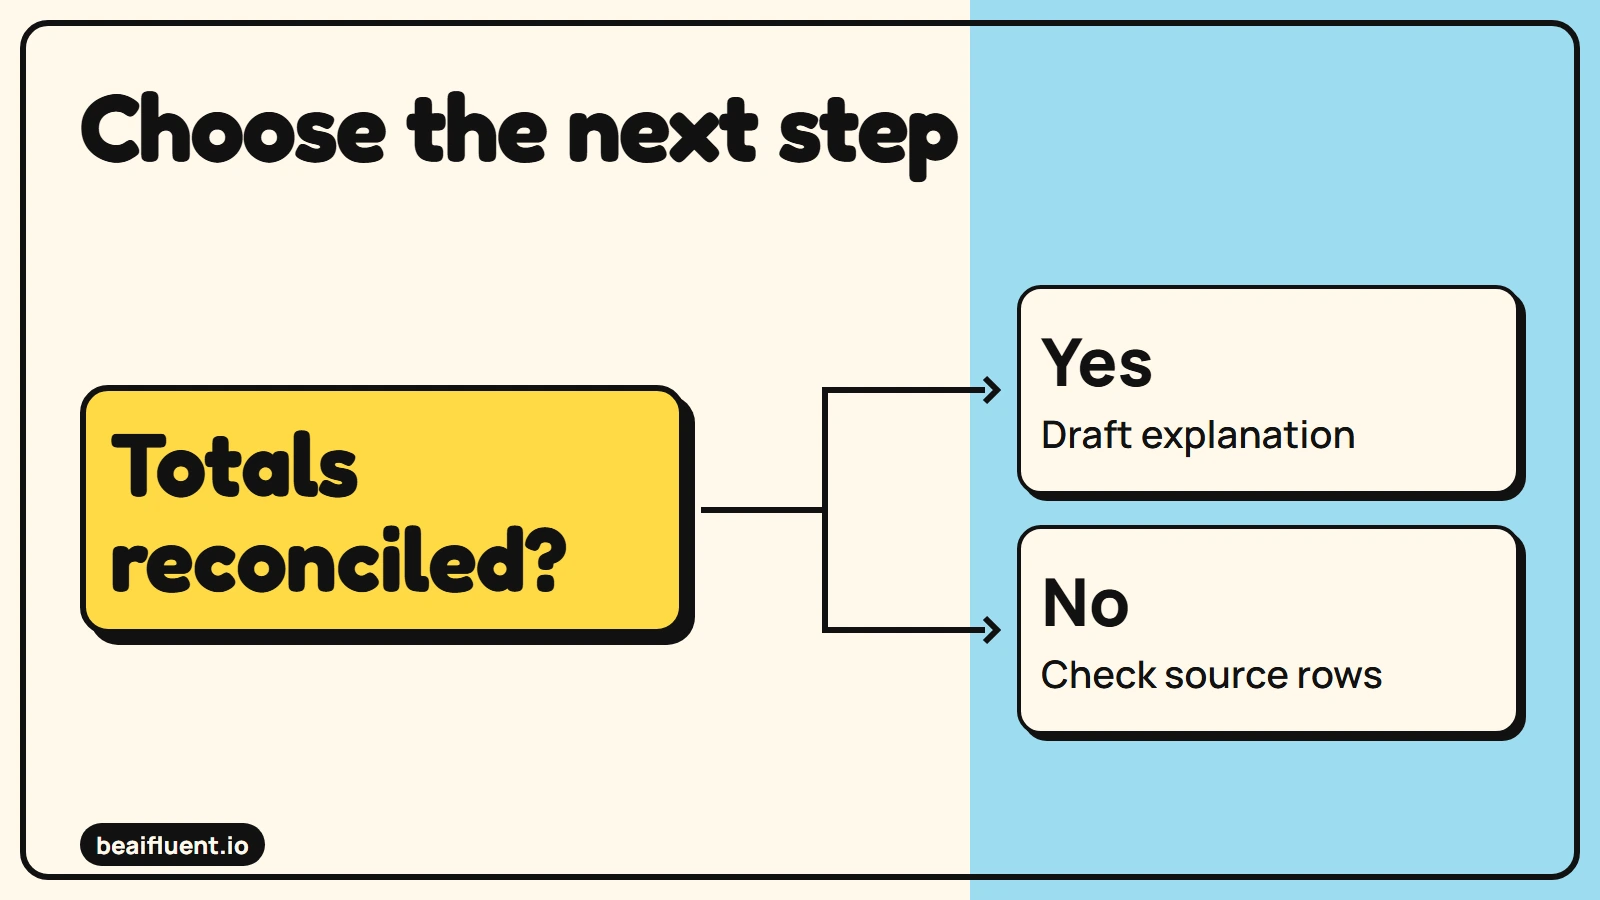
Resolve uncertainty before the next action.
4. Review a restrained report
A suitable reviewed reference paragraph is: “For the week ending 18 October, the retained records show 26 enquiries, six quotes and two acceptances. Quoted value totals PHP 63,000. The known qualified subtotal is nine, but the Social count is missing. Confirm that count before reporting a full qualified total.”
Before accepting the paragraph, notice what it leaves open. It makes no claim about growth, conversion, profit or which channel deserves more spending. Those decisions need stronger data than this snapshot provides.
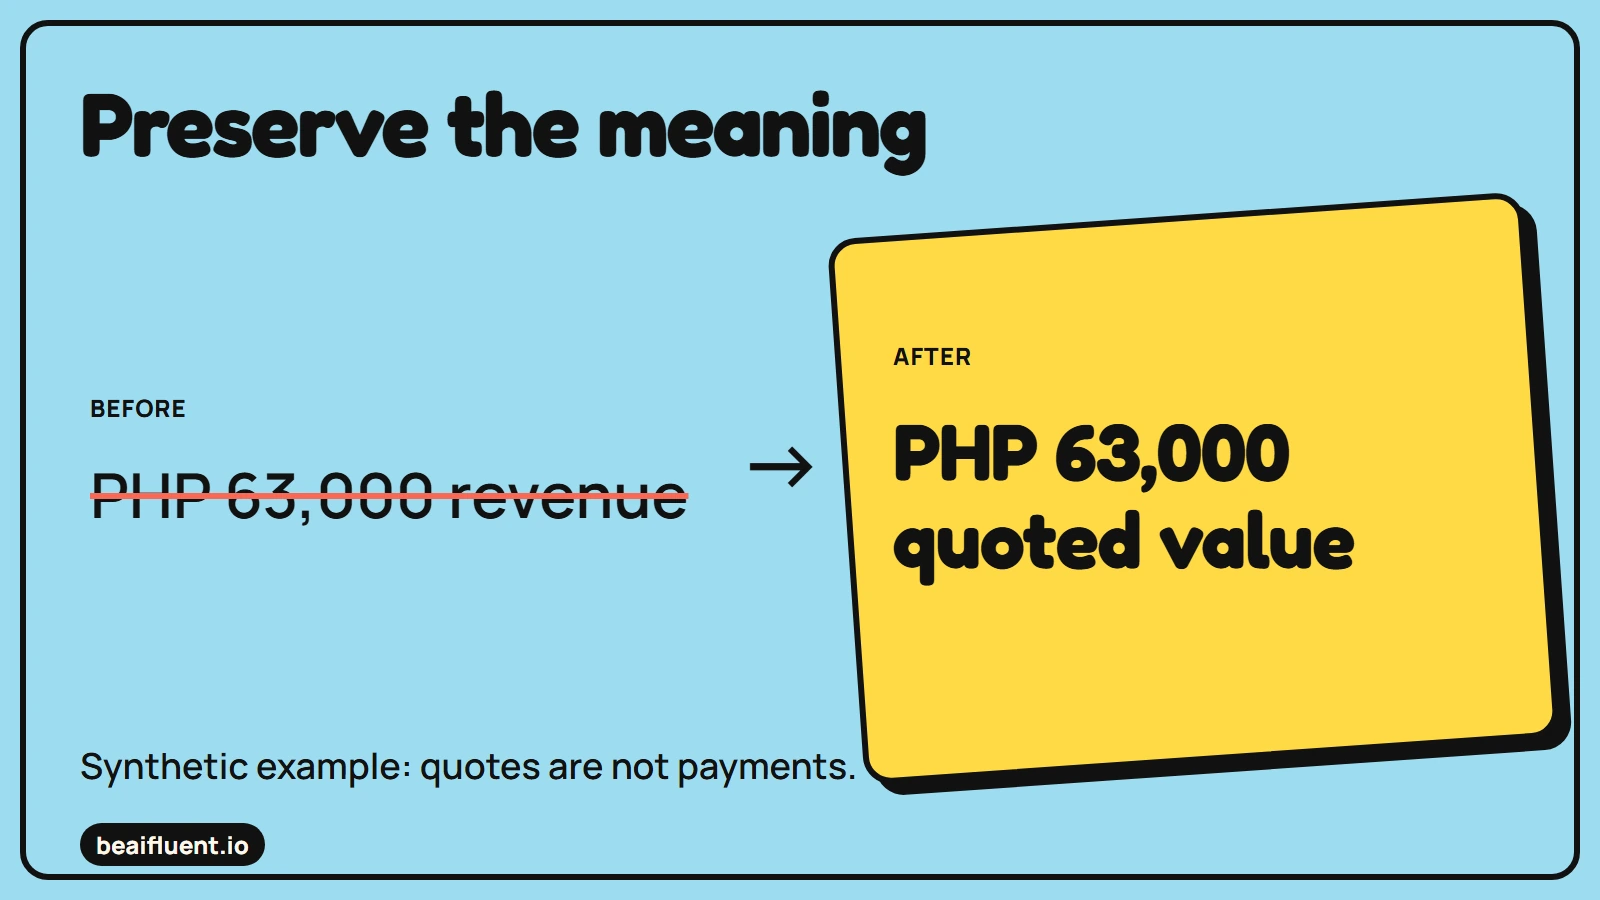
Synthetic example: quotes are not payments.

The example uses retained, deduplicated sample rows.
The follow-up is concrete: ask the Social source owner for the missing qualified count, confirm the duplicated export, and keep the clean rows with the report. After a correction, rerun the calculations and replace the draft with a dated version.
5. Challenge the report before sharing
Our local checks recompute totals from the sample rows and verify the missing-value count. They also test that a changed duplicate, an incorrect total or a missing-value substitution fails the reference rules. This establishes the sample arithmetic and checks, not the reliability of every future export or AI response.
Before sending your trial report to the team, review it against this checklist:
- [ ] The period and currency appear in the report.
- [ ] Identical and conflicting duplicate records receive different treatment.
- [ ] Unknown values remain visible rather than becoming zero.
- [ ] Quoted value never becomes revenue or cash received.
- [ ] Each reported total traces to the retained rows.
- [ ] The narrative contains no invented reason for a change.
If a chart hides missing data, leave it out until the source is complete. A short table with an honest gap is more useful than a polished graphic that suggests certainty. The AI accuracy guide offers a wider review method.
Copy the weekly report template
Paste these rows into a blank sheet. Keep the source and data status with each value. Use formulas in your spreadsheet for arithmetic, then compare the results with the retained source rows before sharing.
metric,current_week,comparison_period,unit,source,data_status,notes
Enquiries,,,,,unknown,
Qualified enquiries,,,,,unknown,
Quotes issued,,,,,unknown,
Accepted quotes,,,,,unknown,
Quoted value,,,,,unknown,
For a numeric column, use SUM only after filtering the right period and resolving exact duplicates. Count missing values separately with COUNTBLANK. A comparison is meaningful only when both periods use the same definition and coverage.
Make the weekly handoff repeatable
After approval, save the raw export, clean rows, calculation notes and report together. Name the person who checks each stage. Once the manual run is stable, decide whether a scheduled export or connected reporting workflow is worth maintaining.
Before uploading actual business records, check permission, workspace settings and current ChatGPT data controls. Remove data the report does not need. A training preference does not replace your company’s rules about customer or staff information.
Questions before the next reporting week
Can AI do the arithmetic? Some tools can run calculations. Still, check key figures in the source sheet or a separate calculation before relying on them.
Should we compare this week with R4? No. R4 contains only one previous-week channel, so it is not a complete comparison for three current channels.
What happens when Social supplies its missing count? Update that source record, rerun the totals and issue a revised report. Preserve the earlier version so readers can see why the figure changed.